2017/09/14 Commentary: Storm Surge!
© 2017 ROHR International, Inc. All International rights reserved.
Extended Trend Assessments reserved for Gold and Platinum Subscribers
Commentary: Thursday, September 14, 2017
Storm Surge!
 As it turned out the sheer destructiveness of Hurricane Irma’s winds were more of a problem for a far broader area than the limited area affected by Hurricane Harvey in Texas. Yet water damage from Harvey becoming a tropical storm feeding on the warm Gulf of Mexico water was repeated by Irma’s winds whipping up major waves, and then rainwater damage from just sheer flooding through the entire state of Florida. That is due to the degree to which it was a super-storm so large (approximately 400 miles across) for much of its existence. That meant during its move north up the west side of Florida’s long 150-mile-wide peninsula (i.e. excluding the upper panhandle) its winds reached out well into the Atlantic.
That brought an actual storm surge onto the eastern side of the state, most notably to heavily populated Jacksonville as the St. John’s River overflowed its banks. In fact, there is still significant standing water in central Jacksonville that the authorities warn will take up to another week or more to subside. The problem there is much as we had noted for southeast Texas: it is the watershed into which waters from inland in the Carolinas will continue to drain via the river, in addition to being affected by daily tidal shifts. The last Jacksonville flooding of this magnitude was in 1846.
Yet that destructive surge is not the one we are referring to in the title of this post. That is the ‘surge’ in US government spending that will naturally occur (as surely as the weather) to assist with rebuilding of the hurricane and storm damaged areas. Irma was a record hurricane on quite a few measures, even if the greater reconstruction spending will likely be in response to Harvey’s southeast Texas flooding. The latter will likely set records beyond the Hurricane Katrina expense, and their combined cost will surely be a major new reconstruction record in the hundreds of billions of dollars.
More below, yet only after the degree to which, along with ‘other factors’, that is driving trends in each asset class. That of course includes the equities looking forward to the major US cleanup and reconstruction building boom, the govvies becoming a bit negative after the recent rally, and the US dollar possibly remaining weak overall.
Authorized Subscribers click ‘Read more…’ (below) to access balance of the discussion. Non-subscribers click the top menu Subscription Echelons & Fees tab to review options. As this is a ‘macro’ assessment, Market Observations remain the same as last weekend’s WEEKEND: Truculent Trump Tribulations post that were updated (lower section) Tuesday morning, and there is no Extended Trend Assessment in this post.
NOTE: REVISED 2017-08-31: Like many others, we were encouraged by the likelihood the US economy would get the structural reform we (along with Mario Draghi and others) had been loudly complaining was not forthcoming since our dual It’s Lack of Reform, Stupid posts in January 2015. Since our December 8, 2015 Extended Perspective Commentary we were concerned about various factors that included continued high taxes and more regulation (i.e. under Clinton) that might have meant a continued weak, or even weaker, US economy. It was hoped Donald Trump’s election would change that. However, much like the estimable Ray Dalio (see our August 24th Commentary: Trump Troika post) and others, we are now very concerned that the US President’s diminished relationship with the Republican Congress will mean his tax reform and infrastructure spending agenda will have trouble getting passed into law. And that will quite possibly be a problem for any US economic acceleration, and high-priced US equities.
[Thanks to www.cnbc.com for opening graphic. © 2017 All rights reserved.)
 And most prominent among those ‘other factors’ driving current trends in the major asset classes is inflation. And this week has had its share of both stronger inflation and other various growth indications. Tuesday saw higher than expected UK inflation (unlike the US they release all components at the same time), followed by their above estimate employment indications on Wednesday. Along the way there were stronger indications on the German Wholesale Price Index as well as the equivalent Swiss figures.
While Wednesday’s US PPI was a bit weaker, that was superseded by this morning’s stronger than expected US Core CPI, one of those indications the Fed is keying on for its next moves on accommodation removal. Even though it remains below the Fed’s 2.0% target, the uptick was not predicted. And getting back to central bank activity, there was also this morning's well-anticipated ‘no action’ by the Bank of England in holding its base rate at 0.25%. That was in spite of stronger employment and higher core 2.7% annualized inflation indication clearly above its 2.0% target, yet with good reason.
As outlined at the August Inflation Report press conference, the BoE still believes that the headline inflation is due to Brexit-driven foreign exchange factors. It wants to not lean too heavily into an economy where the best defense against lower real incomes (due to the inflation factor) is to allow for maximum employment. That has been its clear position for a while, and it will only be forced to raise rates if inflation should increase further.
There is quite a clear explanation of all of this in the post-rate decision meeting Monetary Policy Summary statement (our modestly marked-up version.) It is very interesting in outlining that the current headline inflation at 2.9% “…is now expected to rise to above 3.0% in October.” It leads one to question what indeed it will take for the BoE to actually raise rates after today’s 7-2 vote to hold steady.
Market Implications
And this forbearance from one of the major developed economy central banks at the same time as the Fed has reasons to be circumspect and the European Central Bank appears to want to remain accommodative in spite of the resurgent Euro-zone economy has clear implications. As noted above, US equities leading the way up are now joined by others that are coming up from lower reactions if not matching the US performance as yet.
One of the key aspects to remember is that the initial inflation increase it not typically met with any equities weakness due to central bank tightening. That inference is the mistake many have made across multiple cycles, when in fact the equities are encouraged by a bit of inflation as a sign of economic strength.
On the other hand, where many participants feel that central bank rate increases are negative for the govvies, central banks looking like they are behind the curve on necessary increases have historically been worse for the govvies, as long-term rates typically lead the way up. And as far as the US dollar is concerned, it may be too obvious a view, yet it is hard to believe a flood of US government reconstruction spending is going to be constructive for the greenback.
And the most recent activity in the US equities points to a further extension of the new record levels seen this week (for the reasons we explore below.) As noted since late July, there was September S&P 500 future resistance into 2,475-80. That resistance was intensified in early August after the failure from above that area left a fresh weekly DOWN Closing Price Reversal (CPR.) That reinforced the importance of 2,475-80 resistance at which it failed repeatedly.
Yet that weekly DOWN CPR Tolerance was the 2,480.50 late-July trading high. Now that it was overrun on Monday’s rally extension the next resistance is into the 2,505-10 weekly Oscillator threshold (MA-41 plus 130-135.) Interestingly that is the extension at which it stalled into 2,475-80 area in early August, with the increase in weekly MA-41 over the past month now also raising that resistance. Major extended Oscillator resistance not seen since March is the 2,535-40 area.
As far as lower support if it reacts, part of the push to a new high was the September S&P 500 future exceeding June’s 2,451-46 congestion highs and holding it as support into mid-July. As recent trading has confirmed, 2,451-46 congestion remains a key area. Pushing above it in late August was a constructive sign, and it remains lower support.
Govvies that finished last week near the tops of their recent rallies had to allow that while it was still major, the Hurricane Irma destruction in Florida was less than expected at the end of last week. That meant less of a drag on the US economy than was expected, leaving room for the govvies to react back down below some resistances they had nominally pushed above last week.
While the extended lower levels remain much the same as Tuesday morning’s Market Observations update of last weekend’s post, there are key signs of weakness in the current near-term selloff. Those include the September T-note future dropping back below its mid-June 127-18 rally high that it exceeded last week for a new 10-month high. The September Gilt future higher resistance was once again in the 128.00-.50 area, which it only modestly exceeded over the past couple of weeks. The weight of the recent UK inflation and employment indications has dropped it all the way back into the top of the 126.50-.00 area.
And the September Bund future expiration a week ago sharply dropped the front month Bund future on the hefty December contract discount. That left the December Bund future back into prominent lower 162.50-.00 support. And it also requires further monitoring now as it has slipped below that congestion, with 161.50 and 160.50-.00 as lower supports.
Foreign exchange has seen a modest recovery of the US Dollar Index as a proxy for the trend in many other currencies against the greenback. It is recovering from below its 91.91 2.5 year low violated on last week’s Close. That has a Tolerance of no daily Close back above the 92.52 Negated weekly UP Closing Price Reversal from two weeks ago, which it has now tested over the past couple of days.
That is also some previous congestion, and any sustained activity above it would speak of stabilization for now, even if any further upside correction is limited. Yet as noted above, unless the trend indications reinforce a different view we remain skeptical a flood of US government reconstruction spending is going to be constructive for the greenback.
Dual Hurricane Reconstruction Bill
This can be rather concise on what are still calculations in progress. Yet, that said, the estimates of the cost to get Texas, Florida and the US Virgin Islands back into working order that approximates their economic conditions and living conditions prior to the dual storms keeps on rising. And the amounts it is rising to are mind-boggling, even before the additional infrastructure and private company spending that is going to be required to mitigate the impact of any future storms.
Hurricane Harvey turning into Tropical Storm Harvey dropped a month’s worth of water on the Houston area and southeast Texas in a matter of five days. The reconstruction bill in light of all of the homes that will be deemed ‘destroyed’ (once they can even get the full number of inspectors in to complete that major task) is likely to rise to at least 100,00, with many thousands more needing major reconstruction. That includes stripping the homes down to the studs and treating them with anti-mold and septic disinfection treatments prior to pretty much rebuilding the extended structure.
Even allowing that some portion of the expense will be borne by insurance companies for the relatively limited number of folks who had flood insurance, the full bill is expected to exceed $200 billion. So allowing that possibly $20-30 billion will be covered by insurance, this still leaves the US federal government facing a bill of at least $170-180 billion.
Federal Support?
And it is a good question as to why the government should underwrite that magnitude of repair bill for folks who did not have private insurance? The answer is easy: Most folks who did not have insurance were in areas that were not considered at risk of any flooding under the assumed worst case scenarios. And many of those folks are key employees of the businesses down there.
So what is the federal government to do? Simply allow that this is a bad situation, but it is going to let Houston (the fourth largest city in the US) significantly shrink? That seems to be a humanitarian and commercial and electoral disaster. And everything we are saying here applies equally as a much to the Hurricane Irma destruction, and even more so as we will clarify below. Yet prior to the prominence of the US government in the local storm reconstruction matters, that is exactly what could happen to a thriving area.
In 1900 the Great Storm (as it was known prior to the naming of hurricanes) hit Galveston. With the town and island only 8.7 feet above sea level, the storm surge of more than 15 feet basically destroyed everything on the island, with great loss of life as well. While there were improvements to the storm mitigation system (sea walls, etc.) after that disaster, the rise of Galveston as possibly the most dynamic commercial and political hub in Texas faded away.
In fact, due to the rise of the budding oil industry, investors and businesses all shifted development to Houston. Yet there is no alternative to Houston now that it holds such a prominent position in refining and other industries. So one way or another (some of which might be low- or no-interest loans) the US federal government will indeed step into to fund both reconstruction and likely very expensive storm mitigation efforts.
Caribbean and Florida Even Worse
However, even though the expense of reconstruction might be somewhat higher for the Harvey remediation in Texas, in its way the Irma devastation in Caribbean and Florida was even worse. That is due to the nature of the sustained hurricane wind and rain destruction.
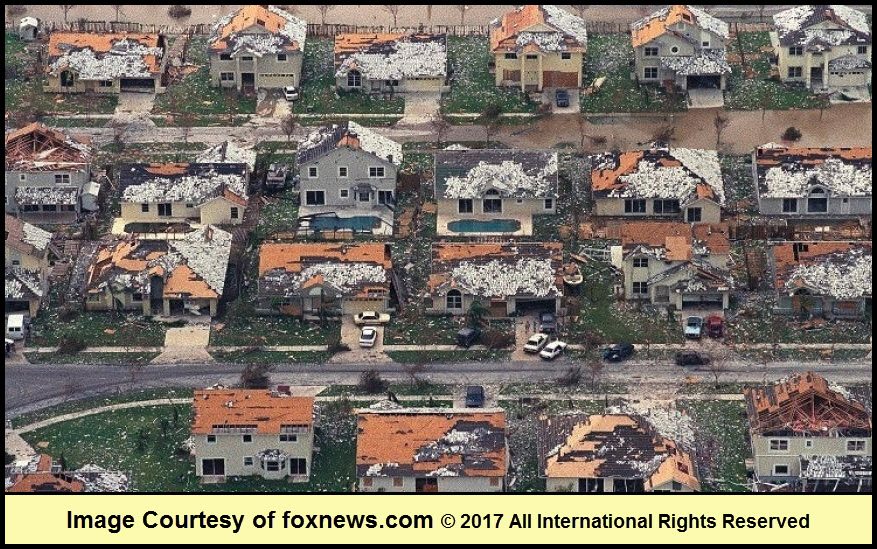
This image is of the Homestead area in Florida, which is on the eastern side of the peninsula near Miami. It is fairly ugly, yet does not compare with the total destruction that Irma visited on the Florida Keys and the Caribbean that includes the US Virgin Islands. While the roofs torn off and sides of buildings imploded is tough, it allows these owners to rebuild based on some significant amount of remaining structure. Yet in much of the Florida Keys and the Caribbean (including many areas not US territories as well as northern Cuba) they were not so lucky. In those areas Irma’s sustained 145 MPH winds reinforced by the torrential rains simply collapsed or wiped away many of the structures.
As described by the surviving locals and evident in the graphic images, it was as if Irma acted like a huge wire brush that simply scrubbed the landscape of almost all structure. That lack of standing buildings is of course compounded by the failure of all local systems, including power. That means the failure of water systems that rely on pumps (for sanitary purposes as well) and lack of any refrigeration for food along with the inoperability of ports to even allow for delivery of relief supplies.
The Total Bill
And that is just the dire immediate circumstance, which will require very extensive expensive action to prevent further human tragedies. However, reconstruction is another matter, and that gets us back to the Keys as a sign of things to come.
Quite a few of the communities in the Keys are/were retirement areas where folks are happy to live in affordable prefabricated housing or stationary mobile homes. It is those communities where folks are already on fixed incomes and have few resources of their own to rebuild, which will be an issue for the US government.
Once again in commercial (as in making the Keys and other areas attractive to holiday makers again), humanitarian (as these folks do not have anywhere else to go) and electoral (due to the number of people who want the federal government to assist people in need after a tragedy), can the federal government just walk away? Not likely; no more so than when Super-Storm Sandy ravaged the Northeast.
As such, even if some limited amount of it will come from the coffers of insurance companies, the combined Harvey ($200 billion+) and Irma (likely $100 billion+ when all of the assessments are done) reconstruction bill will be in excess of $300 billion. Assuming that even $50-60 billion of that will be borne by the insurance companies, it leaves the US federal government with a bill in the vicinity of at least $250 billion. And once again, some reasonably large amount of that may be in the form of low- or no-interest loans, which are therefore not an outright gift.
Overall Economic Impact
However, the combined reconstruction spending from the insurance companies and the government must still be considered for its overall intermediate-term economic impact. And that may be a bit of weakness in sectors like tourism, yet with a major boom in the more important building materials and construction trades.
That is our reason for feeling the impact on the market activity in various asset classes has already reflected the storms’ influence, and will continue to do so. As such, at least in the near term we suspect the equities (led by the US) will remain stronger, the govvies concerned about inflation and stronger employment beyond the immediate crunch will be a bit weaker than the recent up trends (i.e. react back down at least to lower supports), and the US dollar will continue to struggle in the face of more greenbacks surging into the post-storm reconstruction efforts.
There is no Extended Trend Assessment in this post. In spite of the short-term impact of various matters reviewed previous and above, the Market Observations remain very much the same as Tuesday morning’s update of the last weekend’s WEEKEND: Truculent Trump Tribulations post.
Thanks for your interest.
The post 2017/09/14 Commentary: Storm Surge! appeared first on ROHR INTERNATIONAL'S BLOG ...EVOLVED CAPITAL MARKETS INSIGHTS.


